This is an update from my previous post about the health of the Julia programming language.
See that post for an introduction to Julia, and my interest in it, as someone teaching data science.
The source for this document is a Jupyter Notebook. You can get the original
hows-julia-2020.ipynb notebook from the Github repository of this
blog.
Summary
As for the previous post, I collected time-series data from the Julia language repository commits, proportion of Github PRs, and two language ranking sites.
The update from April 2019 gives further evidence to suggest that Julia is not growing quickly.
Health of the Julia repository
This is an update on the health of the code repository for the language itself. That repository has the code for the base Julia language and its standard libraries.
Again, I used some code to analyze commit history kindly posted by Thomas Caswell.
Following Thomas' recipe, I first took a local clone of the Julia Language repository.
I continued the recipe by using Git on the local clone to extract author + commit date from the Git version control repository from January 1 2013 till now.
echo 'time&name' > julia_commits_2020-02.csv
git log --no-merges --since=2013-01-01 --pretty=format:'%at&%aN <%aE>' >> julia_commits_2020-02.csv
There's a copy of julia_commits_2020-02.csv in
downloads/julia_commits_2020-02.csv.
The previous post had a plot of contributors ordered by their number of commits against the cumulative number of commits, as an index of breadth of contribution. See that post for code to replicate that plot with the data here. It has not changed much since April 2019.
The next figure is a plot of the number of commits and number of committers per week:
These plots continue to suggest that Julia development has fallen off to a steady rate of around 40 commits per week since the first release in August 2018.
Percentage of all Github pull requests
This is an update of the proportion of Github Pull Requests that are in the Julia language.
I scraped these data by hand from the Githut 2.0 site.
Here is a plot of the Github PR percents for R and Julia.
The PR numbers for Julia continue to look rather like the commit plot for the Julia language repository, and suggest that relative activity dropped to a steady level around the beginning of 2018.
For comparison, here are the values for Python, R and Julia for the last two years:
TIOBE language index
See the previous post for an introduction to the TIOBE index. The values here come from https://archive.org copies of https://www.tiobe.com/tiobe-index.
The data file with the index values is downloads/julia_tiobe_2020-02.csv.
Some values were below the reporting threshold for the TIOBE index, in which case I gave Julia the index value for the lowest language that was reported.
The plot suggests that Julia is has been hovering around a fairly stable score of around 0.2% since the beginning of 2018. For comparison, the February 2020 values for Python and R were 9.345% and 1.005%, respectively.
Redmonk Programming Language Rankings / Stack Overflow
See the previous post for an introduction to the Redmonk ratings.
The scores below are from the main text of the:
| Year | Quarter | Position |
|---|---|---|
| 2019 | 3 | 33 |
| 2019 | 1 | 34 |
| 2018 | 3 | 36 |
| 2018 | 2 | 39 |
| 2018 | 1 | 40 |
| 2017 | 4 | 52 |
Quoting from the June 2019 rankings page:
Julia remains distant from mainstream usage and visibility, but continues an upward, if glacial, ascent, clocking in at #33 up from #34 in January’s numbers. While on the one hand the trendline is positive if uninspiring, the fact remains that Julia is less popular by this measure than low visibility languages such as Dart (#27), Elixir (#29), Lua (#22) and Matlab (#23). There is nothing to preclude a continued ascent, or even an acceleration of this – there is ample historical precedent. But there is also nothing in either the data here or the market context which would suggest this is likely or imminent.
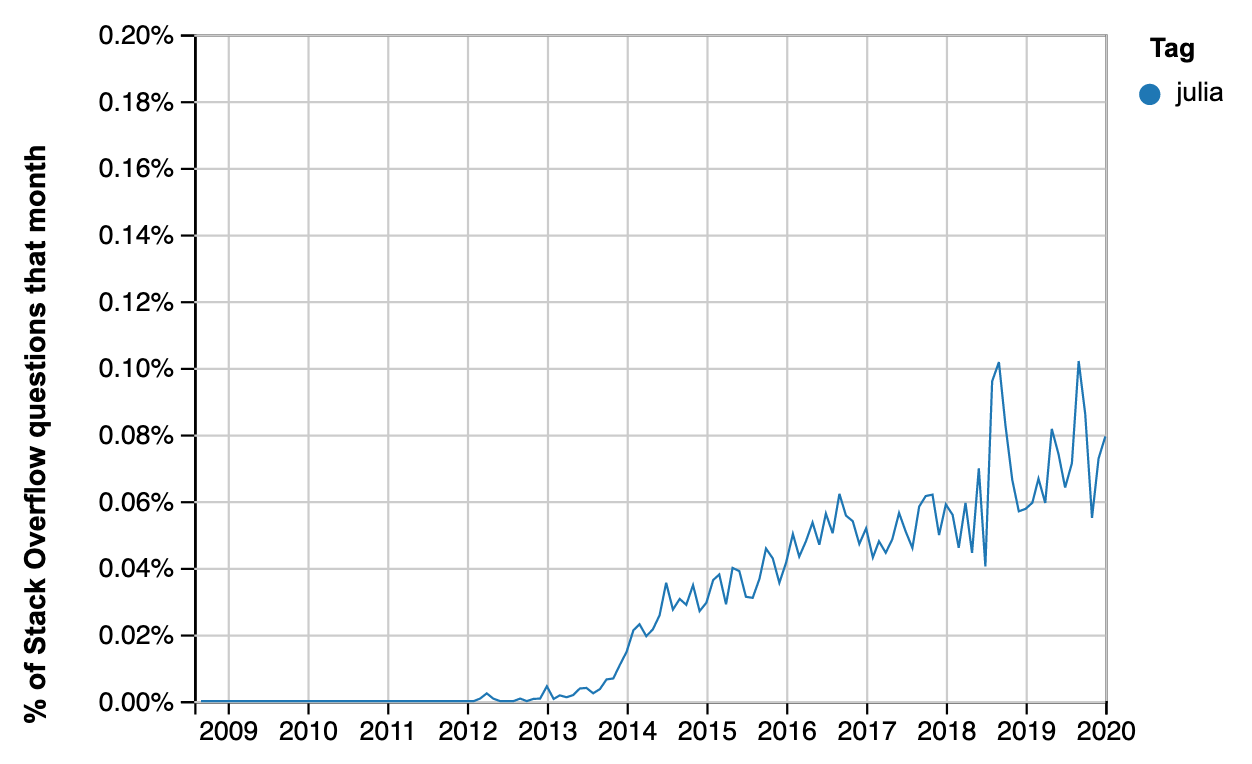
Some data for the Redmonk rankings come from Stack Overflow data. Here is an update of the percentage of Stack Overflow questions on Julia:

The overall pattern over the last few years looks like steady growth of around 0.01% per year, with a couple of ~0.04% spikes. The first spike may be due to the August 2018 release. The second is around the same time as a positive Nature article on Julia.
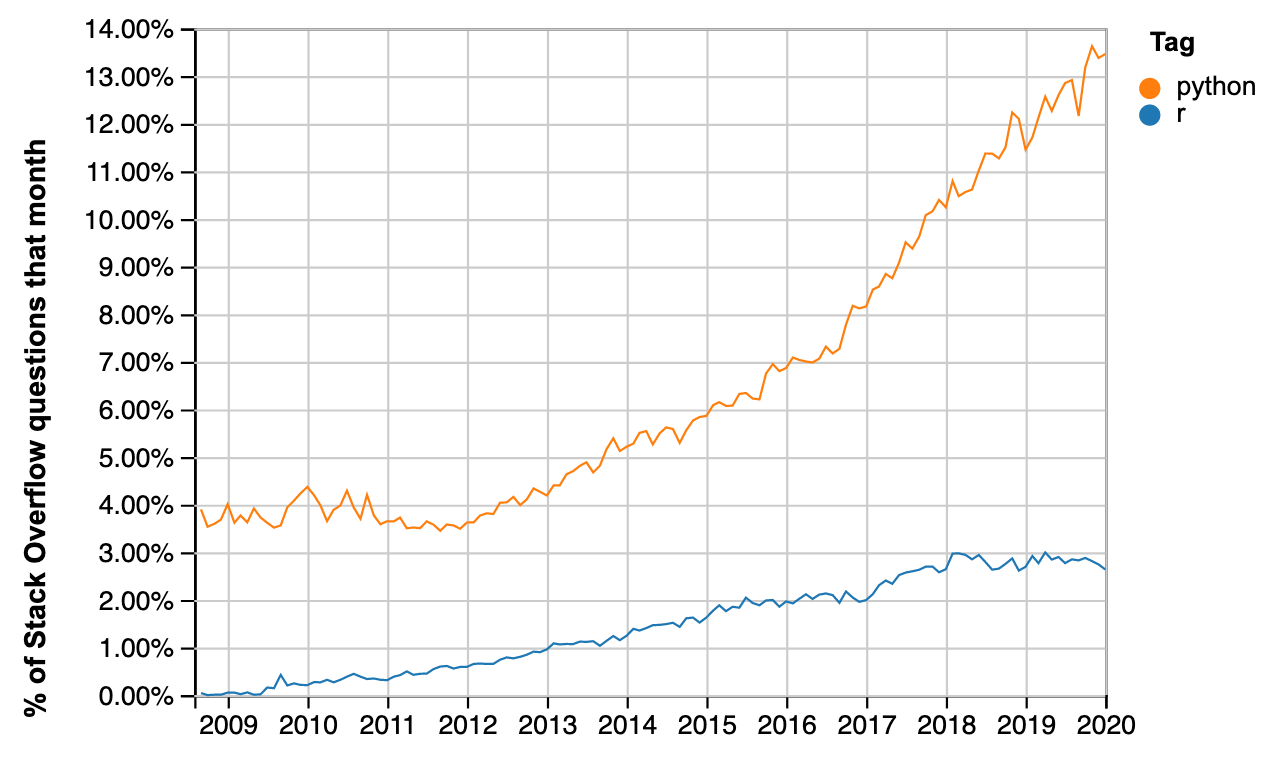
By contrast, Python appears to be growing at around 1% per year:

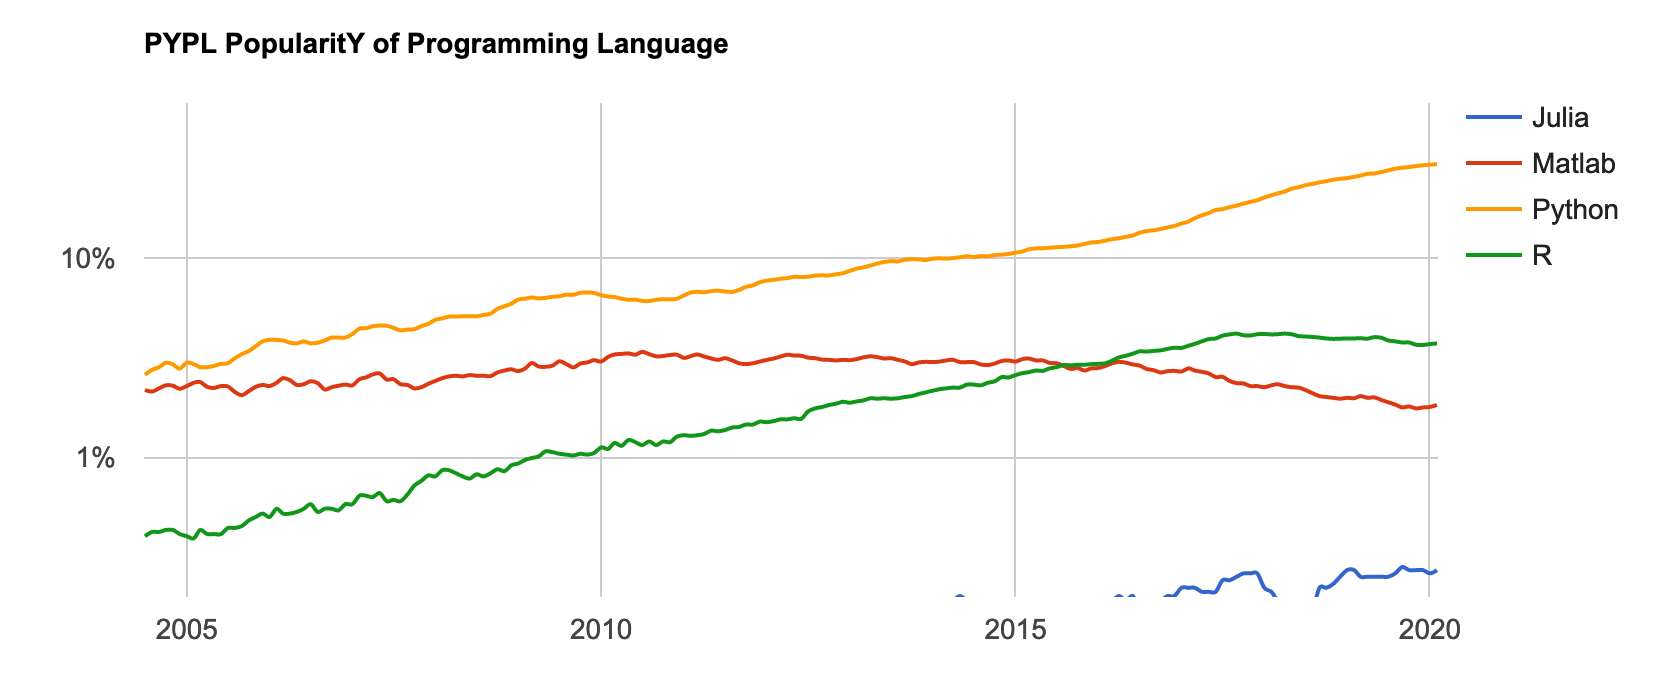
This graphic is a screen shot from the PopularitY of Programming Languages website:

Notice the logarithmic scale.